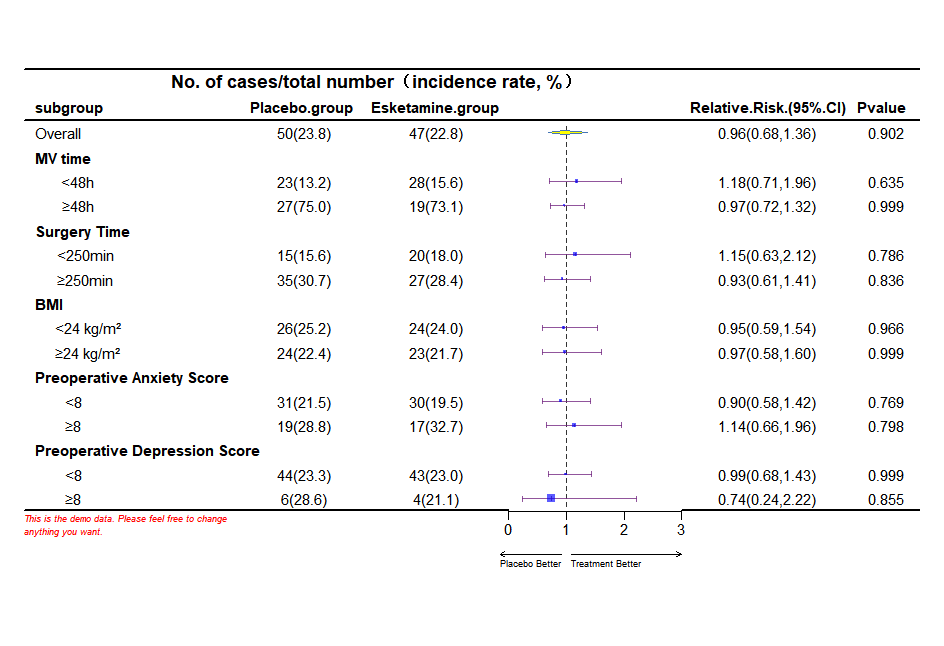
所用R包: forestplot , forestploter 示例数据 森林图示例数据下载 单列森林图(forestplot包) 官方文档:Introduction to forest plots #forestplot包森林图代码附注释 library(forestplot) data <- read.xlsx("森林图示例数据.xlsx…
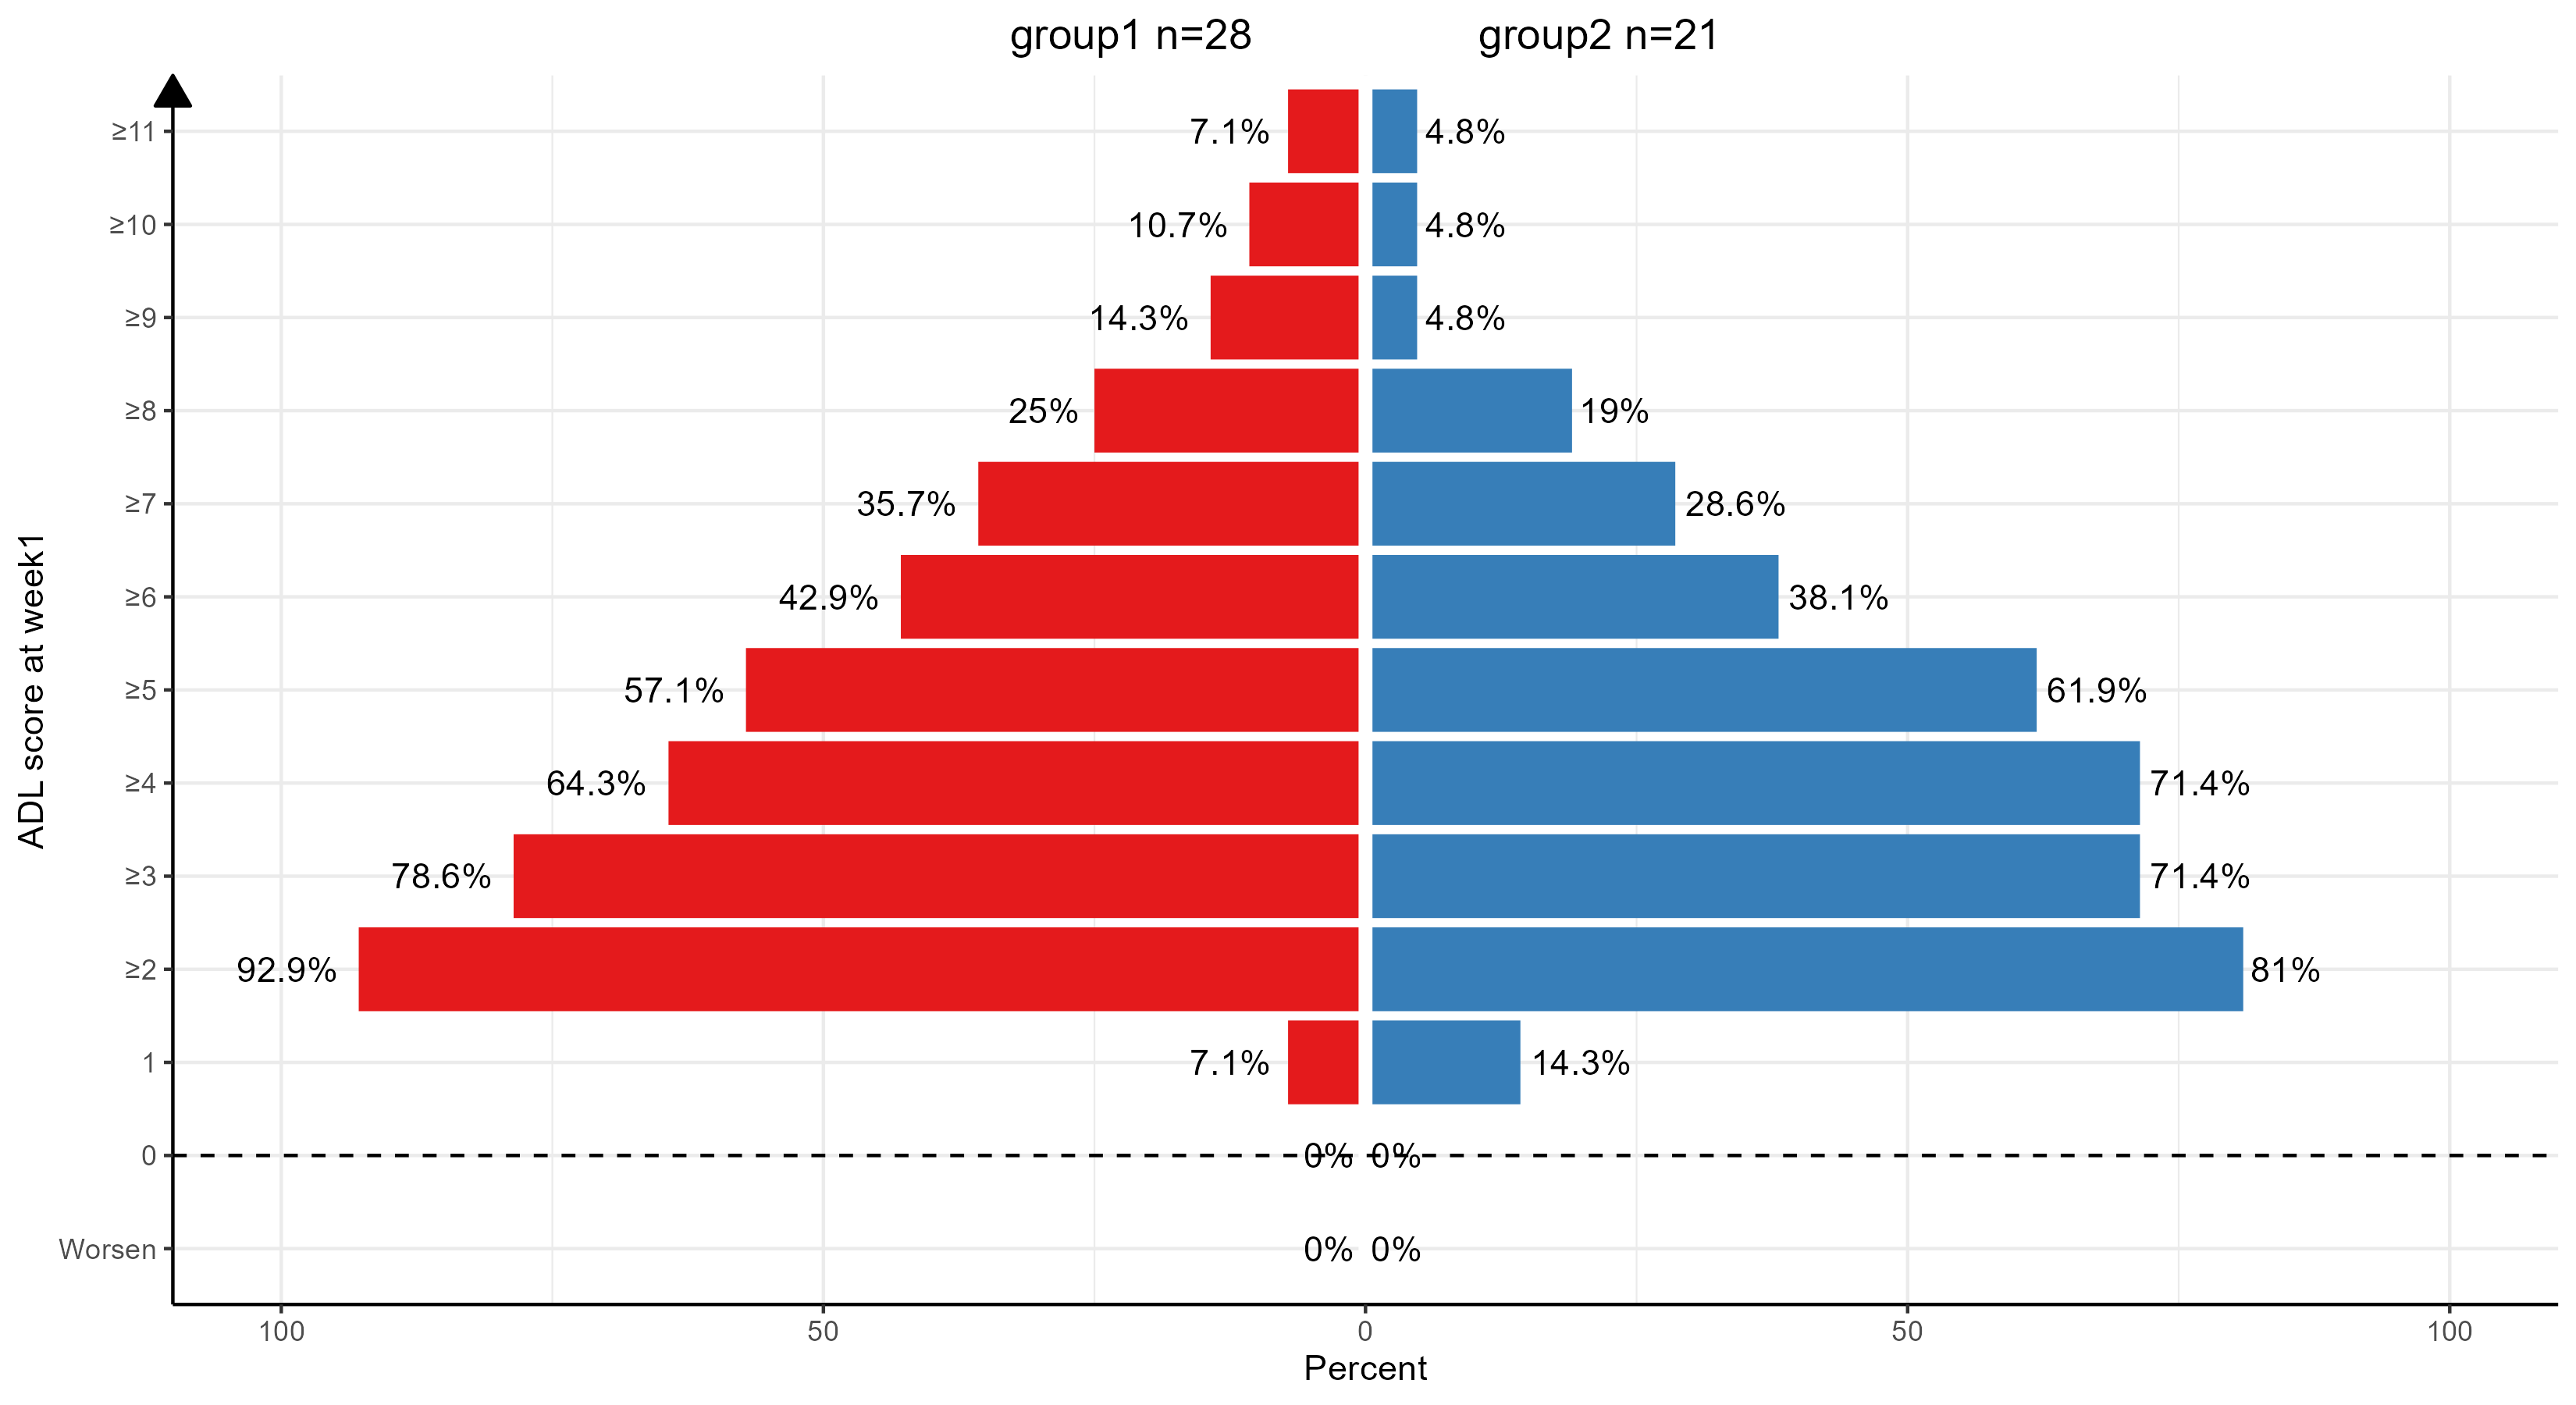
所用R包: ggplot2 1.数据准备 # 定义一个函数,用于生成每个变量的绘图所用数据 generate_test_data <- function(variable) { # 统计每列中大于 1、2、3。。。。的个数 count_values <- function(column) { c( sum(column < 0, …
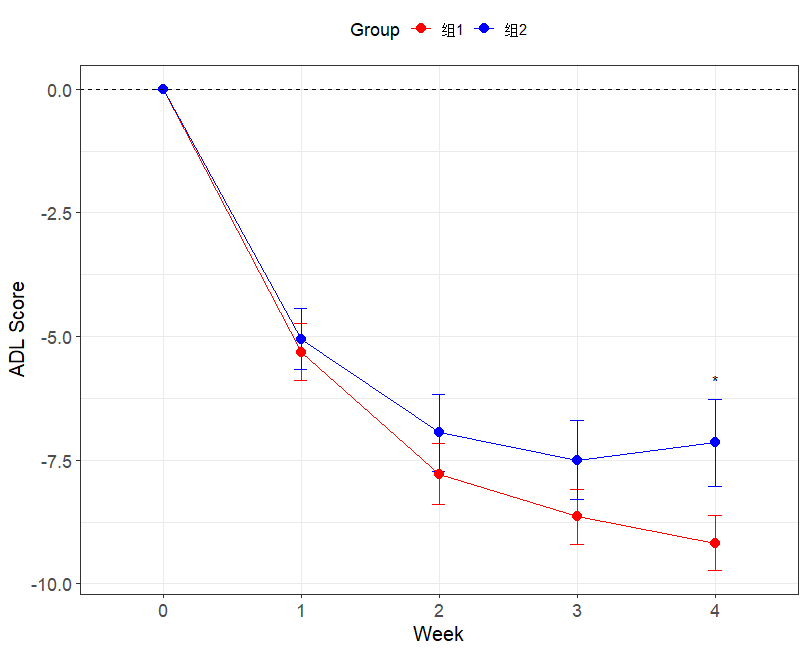
所用R包: tidyverse 1.所需数据计算 t1 <- tibble(id=rep(1:25,each=4),group=1,period=rep(c(1:4),25),value=rnorm(n = 100, mean = 2, sd = 1)) t2 <- tibble(id=rep(1:25,each=4),group=2,…