本文最后更新于 355 天前,其中的信息可能已经有所发展或是发生改变。
所用R包: tidyverse
1.所需数据计算
t1 <- tibble(id=rep(1:25,each=4),group=1,period=rep(c(1:4),25),value=rnorm(n = 100, mean = 2, sd = 1))
t2 <- tibble(id=rep(1:25,each=4),group=2,period=rep(c(1:4),25),value=rnorm(n = 100, mean = 4, sd = 3))
tt <- t1 %>% bind_rows(t2)
tgc <- summarySE(tt, measurevar="value", groupvars=c("group","period"),na.rm=T)
tgc$period <- as.factor(tgc$period)
tgc$group<- as.factor(tgc$group)
#组间差异检验
t.test(tt$value,by="group")
#或使用gtsummay包批量检验
2.绘图
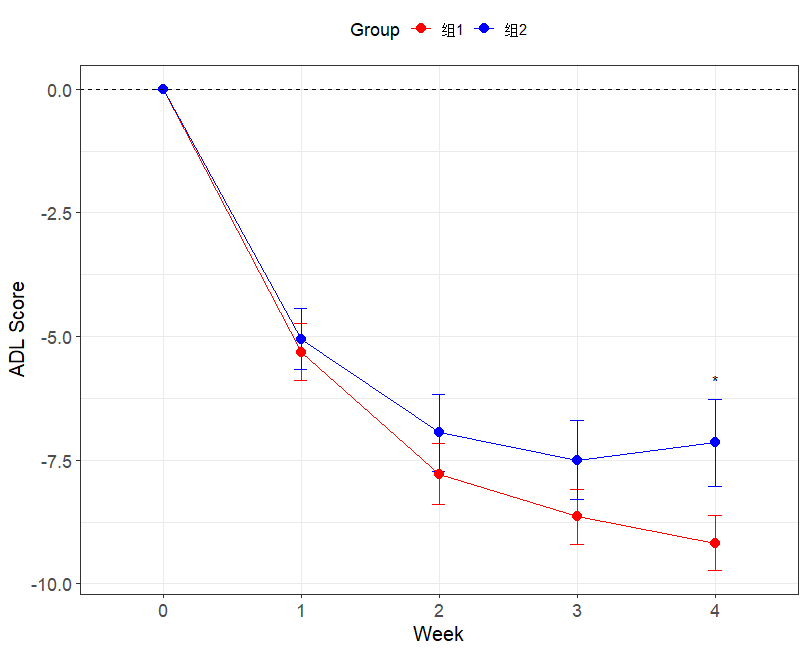
P1 <- ggplot(tgc, aes(x = period, y = value, colour = group, group = group)) +
  geom_errorbar(aes(ymin = value - 1.96*se, ymax = value + 1.96*se), width = 0.1) + # 添加95%误差区间
  geom_line() +
  geom_point(shape = 16, size = 3) +  # 调整点的形状
  annotate(geom="text", x = 1, y = 0.5, label = "*") + #在有差异的时点添加标识符
  theme_bw() +
  labs(
    x = "",                # 编辑x轴标签
    y = "",           # 编辑y轴标签
    colour = ""           # 轴标签颜色
  ) +
  scale_x_discrete(
    breaks = c(1, 2, 3,4),
    labels = c("T0","T1", "T2", "T3") #设置x轴刻度
  ) +
  scale_colour_manual(
    values = c("#4682B4", "purple"),  # 两组颜色
    labels = c("Esmketamine group", "Placebo group")  #图例说明
  ) +
  theme(
    legend.position = c(0.2, 0.90),   # 图例位置
    legend.title = element_text(size = 12),  # 图例文字大小
    legend.text = element_text(size = 10),   # 图例文字大小
    axis.title = element_text(size = 14),    # 轴文字大小
    axis.text = element_text(size = 12),     # 轴文字大小
    plot.title = element_text(size = 16, face = "bold"), # 图标题加粗和文字大小
    panel.grid.minor = element_blank(),    # 去掉网格
    panel.grid.major =element_blank(), # 去掉网格
    panel.border = element_blank(),  # 去掉边框
    axis.line = element_line(color = "black" )#保留刻度线并设置颜色
  )

P1
3.数据及图形示例


