本文最后更新于 253 天前,其中的信息可能已经有所发展或是发生改变。
所用R包: forestplot , forestploter
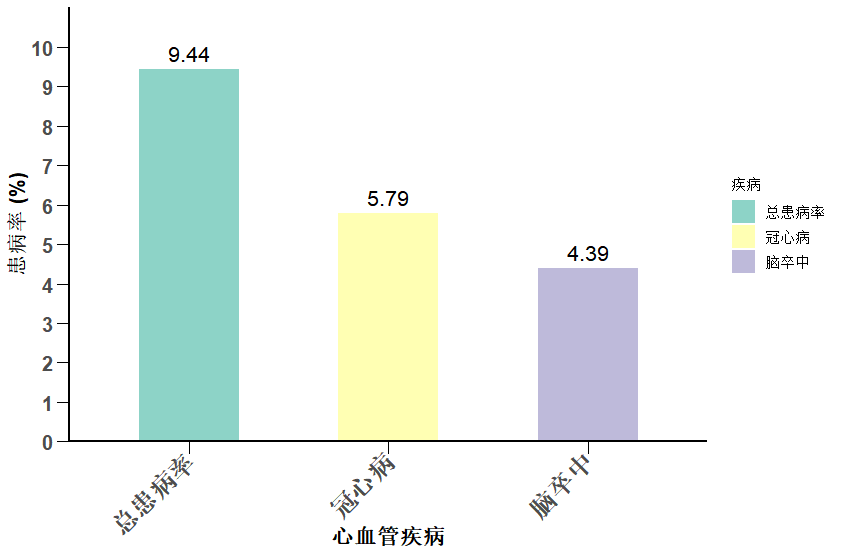
示例数据
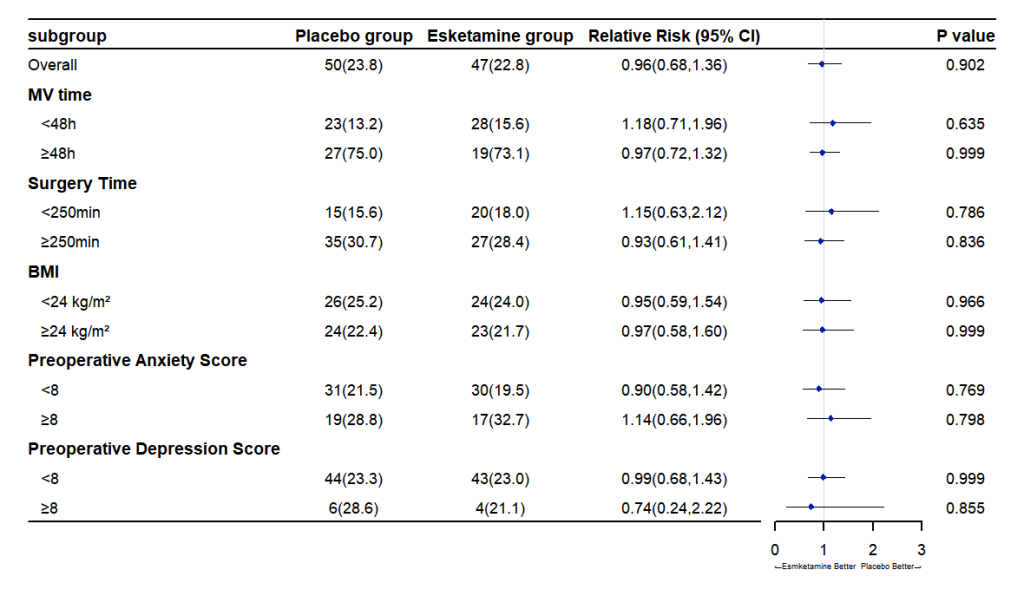
单列森林图(forestplot包)
官方文档:Introduction to forest plots
#forestplot包森林图代码附注释
library(forestplot)
data <- read.xlsx("森林图示例数据.xlsx",sheet=1)

fig<-forestplot(data[,c(1:5)],
                 mean=data[,6],
                 lower=data[,7],
                 upper=data[,8],
                 zero=1,
                 lwd.zero=1, # 森林图参考线
                 lty.zero=2, # 森林图参考线类型
                 boxsize=0.2,
                 graph.pos= 5 ,#森林图的显示位置
                 hrzl_lines=list("1" = gpar(lty=1,lwd=2), #虚线
                                 "2" = gpar(lty=1,lwd=2), #表格上框线
                                 "18"= gpar(lwd=2,lty=1,columns=c(1:4)) ),#表格下框线,column设置其覆盖的列
                 graphwidth = unit(0.15,"npc"), #森林图占整张图的比例 这里是0.3即30%
                 xlab="←Esmketamine Better  Placebo Better→",#森林图坐标轴标签
                 xticks=c(0,1,2,3) , #森林图坐标轴上的刻度
                 is.summary=c(T,F,T,F,F,T,F,F,T,F,F,T,F,F,T,F,F,T,F),#设置有无加粗行,这样即只有第一行表头字体加粗
                 txt_gp=fpTxtGp(
                   label=gpar(cex=1), #表格字符的文字大小
                   ticks=gpar(cex=1), #森林图刻度的文字大小
                   xlab=gpar(cex=0.5), #森林图标题的文字大小
                   title=gpar(cex=3)),  #图标题文字大小
                 lwd.ci=1.5, # 森林图置信区间的线宽
                 lwd.xaxis=2, #森林图x轴线宽
                 lty.ci=1.5,  #森林图置信区间线型
                 ci.vertices =F, #森林图置信区间左右端点是否显示竖直线条
                 ci.vertices.height=0.4, #森林图置信区间左右端点线条长度
                 clip=c(0,3), #森林图HR坐标轴显示的范围
                 ineheight=unit(1, 'mm'), # 每个研究条目的高度
                 line.margin=unit(1, 'mm'),# 线的边距
                 colgap= unit(4, 'mm'),# 表格列之间的间隔。
                 fn.ci_norm="fpDrawDiamondCI",  #绘制置信区间的函数应该不用改
                 col=fpColors(box ='#021eaa',
                              lines ='black')) # 框、线和参考线的颜色

fig
示例图形
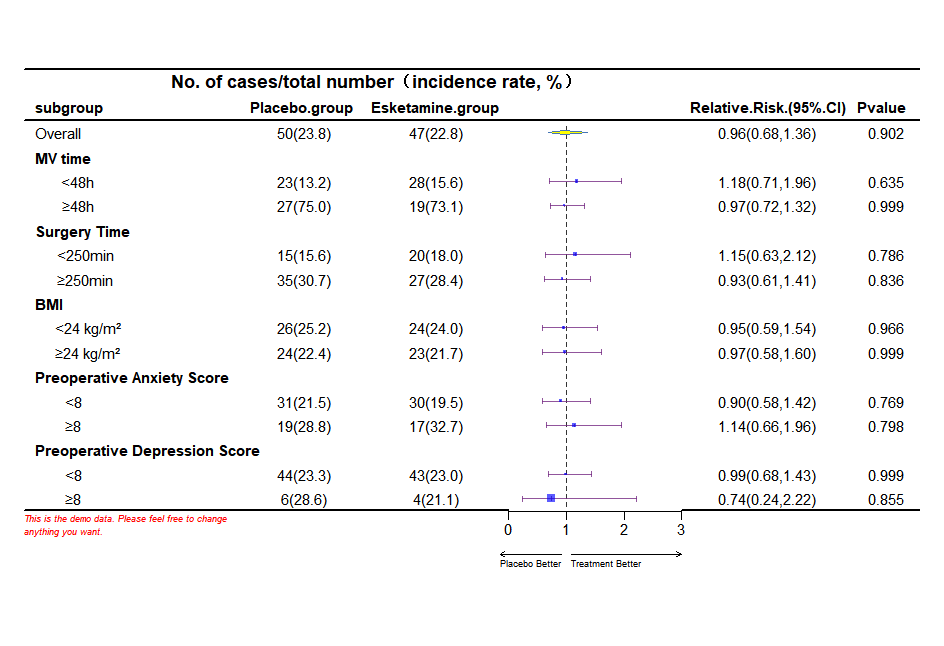
单列森林图(forestploter包)
官方文档: Introduction to forestploter
data <- read.xlsx("森林图示例数据.xlsx",sheet=2)
#数据处理
#有缺失的地方变成一个空格
data$Pvalue <- as.character(data$Pvalue)
data <- data %>% mutate(across(2:5,~if_else(is.na(.),"",.)))

#生成一个变量se,它在绘图的时候表示正方形的大小
data$se <- (log(data$h) - log(data$e))/1.96

#生成一个绘图区间,等下用来绘图
data$` ` <- paste(rep(" ", 20), collapse = " ") #该变量长度决定森林图列的宽度


#图型设置
tm <- forest_theme(base_size = 10,  #文本的大小
                   # Confidence interval point shape, line type/color/widatah
                   ci_pch = 15,   #可信区间点的形状
                   ci_col = "#762a83",    #CI的颜色
                   ci_fill = "blue",     #ci颜色填充
                   ci_alpha = 0.8,        #ci透明度
                   ci_lty = 1,            #CI的线型
                   ci_lwd = 1.5,          #CI的线宽
                   ci_Theight = 0.2, # Set an T end at the end of CI  ci的高度,默认是NULL
                   # Reference line widatah/type/color   参考线默认的参数,中间的竖的虚线
                   refline_lwd = 1,       #中间的竖的虚线
                   refline_lty = "dashed",
                   refline_col = "grey20",
                   # Vertical line widatah/type/color  垂直线宽/类型/颜色   可以添加一条额外的垂直线,如果没有就不显示
                   vertline_lwd = 1,              #可以添加一条额外的垂直线,如果没有就不显示
                   vertline_lty = "dashed",
                   vertline_col = "grey20",
                   # Change summary color for filling and borders   更改填充和边框的摘要颜色
                   summary_fill = "yellow",       #汇总部分大菱形的颜色
                   summary_col = "#4575b4",
                   #change arrow
                   arrow_type = c("open"),
                   arrow_length = 0.05,
                   arrow_gp = gpar(cex=0.5),
                 # Footnote font size/face/color  脚注字体大小/字体/颜色
                   footnote_cex = 0.6,
                   footnote_fontface = "italic",
                   footnote_col = "red")

#绘图
p <- forest(data[,c(1:3,10,4:5)],
             est = data$e,
             lower = data$l,
             upper = data$h,
             sizes = data$se,
             is_summary = c(TRUE,rep(FALSE, nrow(data)-1)),
             ci_column = 4,
             ref_line = 1,
             arrow_lab = c("Placebo Better", "Treatment Better"),
             xlim = c(0, 3),
             ticks_at = c(0, 1, 2, 3),
             background = "white",  # 设置背景为白色,去除条纹
             panel = "blank" ,       # 使用空白面板(如果条纹是由面板产生的)
             footnote = "This is the demo data. Please feel free to change\nanything you want.",
             theme = tm)

p
#细节调整
# 背景改为全白
p <- edit_plot(p, which = "background",
               gp = gpar(fill = "white"))
p
#数据显示位置
p <- edit_plot(p,
               row = c(3,4,6,7,9,10,12,13,15,16),
               col = 1,
               which = "text",
               hjust = unit(0.2, "npc"),
               x = unit(0.2, "npc"))
p <- edit_plot(p,
               col = c(2,3,5,6),
               which = "text",
               hjust = unit(0.5, "npc"),
               x = unit(0.5, "npc"))

# 把2, 5, 10, 13, 17, 20行的文本变成粗体
p <- edit_plot(p,
               row = c(2, 5, 8, 11, 14),
               gp = gpar(fontface = "bold"))

# 在顶部插入文本
p <- insert_text(p,
                 text = "No. of cases/total number(incidence rate, %)",
                 col = 2:3,
                 part = "header",
                 gp = gpar(fontface = "bold",cex=1))

# 在标题下方加一条下划线
p <- add_border(p, row=1,part = "header",where="top",gp = gpar(lwd = 2))
p <- add_border(p,row=2, part = "header",where="bottom",gp = gpar(lwd = 2))
p <- add_border(p,row=16, col=c(1:3),part = "body",where="bottom",gp = gpar(lwd = 2))
p <- add_border(p,row=16, col=c(5:6),part = "body",where="bottom",gp = gpar(lwd = 2))
p


# 其他可做的修改
# 更改3,6,10,11行方块及长条的颜色为绿色
p <- edit_plot(p,
               row = c(3, 6, 11, 13),
               col = 4,
               which = "ci",
               gp = gpar(col = "green"))
p
# 第三行变成红色
p <- edit_plot(p, row = 3, gp = gpar(col = "red", fontface = "italic"))
p
# 在第十行位置插入文本
p <- insert_text(p,
                 text = "This is a long text. Age and gender summarised above.\nBMI is next",
                 row = 10,
                 just = "left",
                 gp = gpar(cex = 0.6, col = "green", fontface = "italic"))

p
图形示例
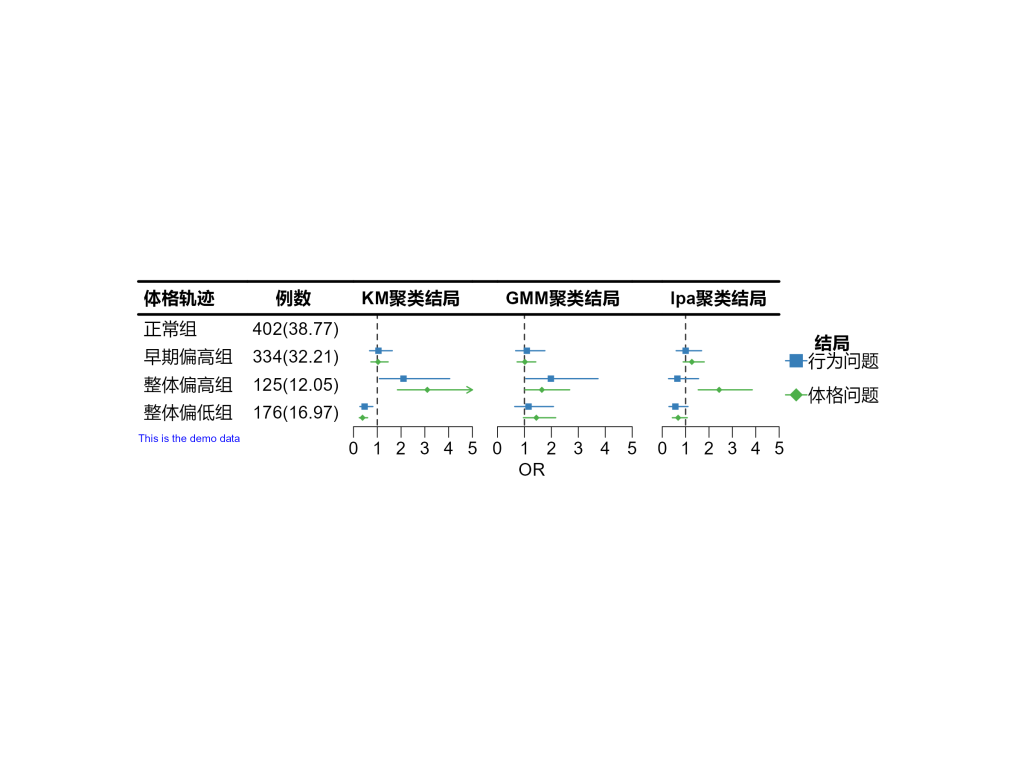
双组多结局森林图 (forestploter包)
forestdata<- read.xlsx("森林图示例数据.xlsx",sheet=3)
forestdata$KM聚类结局 <- paste(rep(" ", 10), collapse = " ")
forestdata$GMM聚类结局 <- paste(rep(" ", 10), collapse = " ")
forestdata$lpa聚类结局 <- paste(rep(" ", 10), collapse = " ")
forestdata$` ` <-""
forestdata$`  ` <-""
tm <- forest_theme(base_size = 10,
                   refline_lty = "dashed",   #参考线类型
                   ci_pch = c(15, 18),
                   ci_col = c("#377eb8", "#4daf4a"),
                   footnote_col = "blue",
                   legend_name = "结局",   #设置标题名字
                   legend_value = c("行为问题", "体格问题"),   #设置分组名字
                   vertline_lty = c("dashed", "dotted"),
                   vertline_col = c("#d6604d", "#bababa"),
                   refline_lwd = 1,       #中间的竖的虚线
                   refline_col = "grey20")


p <- forest(
  forestdata[,c(1,2,23,26,24,27,25)],
  est = list(forestdata$OR_1,
             forestdata$OR_3,
             forestdata$OR_5,
             forestdata$OR_2,
             forestdata$OR_4,
             forestdata$OR_6),  # 分成两组的估计值
  lower = list(forestdata$lci_1,
               forestdata$lci_3,
               forestdata$lci_5,
               forestdata$lci_2,
               forestdata$lci_4,
               forestdata$lci_6),  # 分成两组的下限
  upper = list(forestdata$uci_1,
               forestdata$uci_3,
               forestdata$uci_5,
               forestdata$uci_2,
               forestdata$uci_4,
               forestdata$uci_6),  # 分成两组的上限
  sizes=0.4,
  ci_column = c(3,5,7),  # 两列CI
  ref_line = 1,
  xlim = c(0,5),
  ticks_at = c(0,1,2,3,4,5),
  footnote = "This is the demo data",
  nudge_y = 0.4, #调整两组间距
  xlab=c("","   OR",""),
  theme=tm)
p

#去除背景
p <- edit_plot(p, which = "background",
               gp = gpar(fill = "white"))


#调整标题行对齐位置
p <- edit_plot(p,
               col=c(2:7),
               part="header",
               which = "text",
               hjust = unit(0.4, "npc"),
               x = unit(0.4, "npc"))

#添加框线
# 在标题下方加一条下划线
p <- add_border(p, row=1,part = "header",where="top",gp = gpar(lwd = 2))
p <- add_border(p,row=1, part = "header",where="bottom",gp = gpar(lwd = 2))
p